Machine Learning Techniques for Human Activity Recognition on Smartphones


Introduction###
The mobile phone market has witnessed stunning growth in recent years, reaching 5.6 billion mobile connections in 2011 [1]. Mobile phones are therefore increasingly accessible to the world population and play an ever bigger role in our daily lives. The recent generation of mobile phones, so-called smart phones, distinguish themselves with increased computing power, multi-tasking ability, and sensory inputs like tilt and acceleration. The rich feature set lends itself to studies of Activity Recogniton with the ultimate goal of identi- fying various activities, such as standing, laying or walking, from the device's sensory inputs.
Activity recognition has potentially very significant applications, as demonstrated by the re- cent Kaggle competition "ÂPredicting Parkinson's Disease Progression with Smartphone Data"Â [2], funded by the Michael J. Fox Foundation for Parkinson's research.
This study applies and compares three different machine learning techniques for predicting activities from the sensory input.
Results###
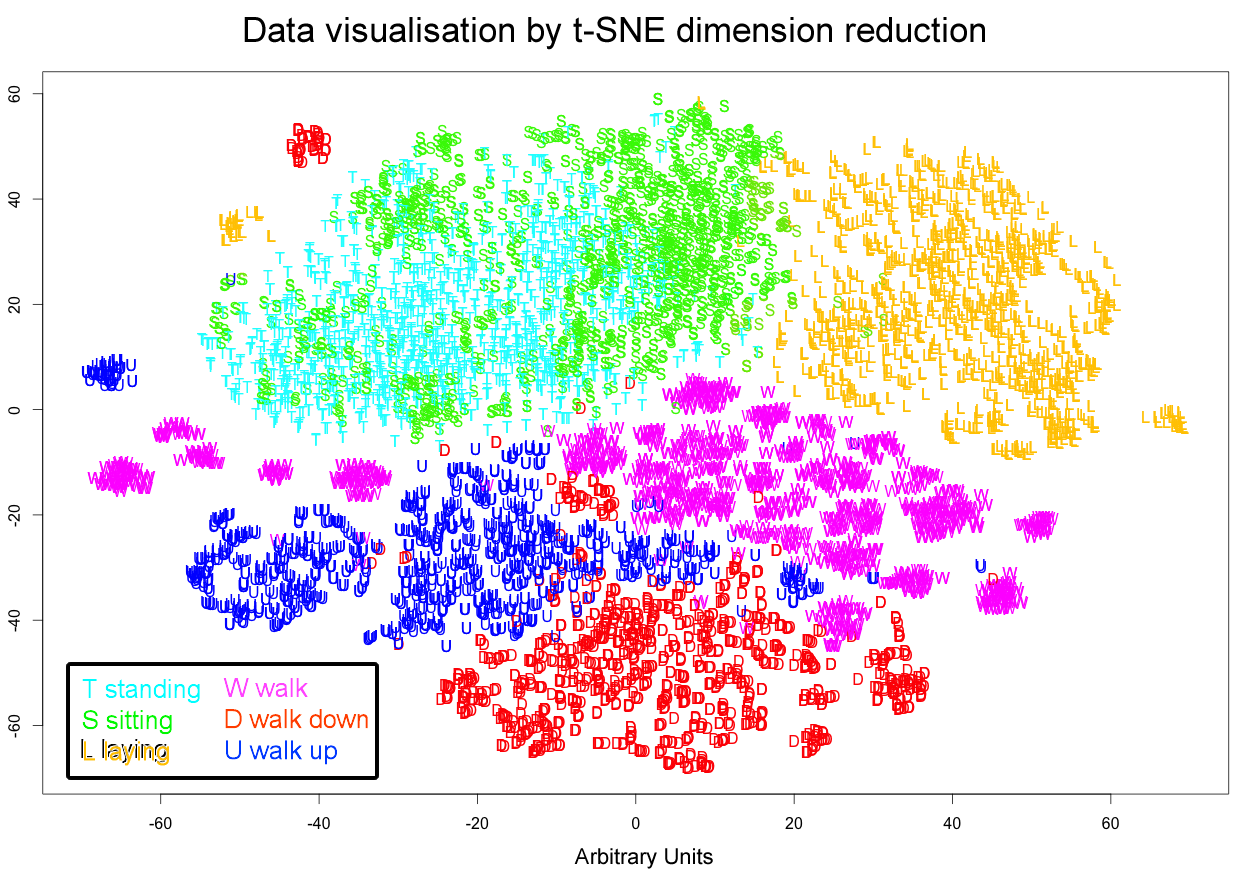
Fig. 1: The plot shows the result of the dimension reduction using t-SNE [7]. T-SNE is a non-linear dimension reduction technique that embeds the 561-dimensional space of feature vectors into a two-dimensional space, while trying to preserve a similarity measure between pairs of points. All 7352 observations of the 30 individuals in the data set were used. The six letters T,S,L,W,D,U stand for the activities: standing, sitting, lying, walk, walk down, and walk up. The plot reveals complex relationships: The non-walking (T,S,L) and walking (W,D,U) activities are well separated, but within these two major activity-groups some confusion occurs. Standing and sitting form a diverse, homogeneous activity-group but both these activities are not well separated. T-SNE also forms many clusters of walking, which indicates that walking has complex characteristics, possibly linked to the individual people. Two very striking, detached clusters of walking down and laying near the standing/sitting activities can be seen. These clusters partially correspond to misclassification of the prediction algorithms.
R code to procuce above plot
# setup
library(tsne)
load('samsungData.rda')
chr <- function(n) { sapply(n, function(x) rawToChar(as.raw(x))) }   # makes char from ascii code
letters <- c(chr(49:57), chr(97:122))       # 123..9abcd...xyz
activity.labels<-structure(c("T","S","L","W","D","U"), names=c("standing","sitting","laying","walk","walkdown","walkup"))
i.subject <- match('subject', colnames(samsungData))    # column index for subject
i.activity <- match('activity', colnames(samsungData))  # column index for activity

# make copy of subset of Samsung data and modify
data <- data[samsungData[,'activity'] %in% c('W','D','U'),]
data[,'activity'] <- as.factor(activity.labels[data[,'activity']])
data$subject<- letters[data$subject]

# run tsne and plot
result <- tsne(data[,-c(i.activity,i.subject)], perplexity=50)
colors = rainbow(length(unique(data$subject)))
names(colors) = unique(data$subject)
plot(result, type='n', xlab="", ylab="", main="t-SNE Dimension Reduction, 'walking' only, labels are individuals ")
text(result,labels=data$subject, col=colors[data$subject])
Link to dataset samsungData.rda.
References
- Gartner Press Release (Accessed 2013-03-09).
- Kaggle competition: Predicting Parkinson’s Disease Progression with Smartphone Data (Accessed 2013-03-09).
- Davide Anguita, Alessandro Ghio, Luca Oneto, Xavier Parra and Jorge L. Reyes-Ortiz. Human Activity Recognition on Smartphones using a Multiclass Hardware-Friendly Support Vector Machine. International Workshop of Ambient Assisted Living (IWAAL 2012). Vitoria-Gasteiz, Spain. Dec 2012 (Accessed 2013-01-01).
- UCI Machine Learning Repository (Accessed 2013-03-01)
- R Core Team (2012). "R: A language and environment for statistical computing."(Accessed 2013-02-15)
- R Markdown (Accessed 2013-02-16)
- Van der Maaten, L., and Hinton, G. (2008). Visualizing data using t-SNE. Journal of Ma- chine Learning Research, 9(2579-2605), 85.
- Breiman, Leo (2001). Random Forests. Machine Learning 45 (1): 532.
- Classification and Regression by randomForest, Andy Liaw and Matthew Wiener, R News, Volume 2/3, December 2002, pp. 18-22
- R library e1071 Misc Functions of the Department of Statistics, TU Wien
- Vapnik, Vladimir N. (1995) The Nature of Statistical Learning Theory, Springer-Verlag.
- Christopher M. Bishop (1996), Neural Networks for Pattern Recognition, Oxford Univer- sity Press.