Getting Worldbank Data with Python

This is a quick note on how to retrieve Worldbank data using Python.
Thanks to the wbdata package it is very easy to obtain Worldbank data. The time-series can be identified on the Worldbank website, then the data can be retrieved. The data can be inspected interactively in order to extract the relevant data from the somewhat inflated datasets returned by Worldbank. Luckily, the convenience functions provided by wbdata make simplify the extraction task significantly and the pandas data analysis framework allows straightforward further processing.
As a concrete example, let's get the inflation time-series for various countries.
First, install the excellent wbdata package. It allows you to explore and retrieve the Worldbank data. The wbdata documentation is very good and the quick intro helps you with the first steps.
Find the right data
Next, find the inflation data on the World Bank Open Data website. The search bar gives good suggestions while typing in the word "inflation". We pick "Inflation, consumer prices (annual %)". The first graph shown is the world inflation average.
The crucial thing to note is the indicator code for consumer price inflation in the page url. It is FP.CPI.TOTL.ZG.
Download and inspect data
In python we want to use the wbdata.get_data function, but first we need the country code. Unfortunately Worldbank created their own country codes. A list of countries can be found with get_country:
countries = wbdata.get_country(display=False)
The obtained list contains dicts with useful information about geography (geo coordinates, capital city, region information) and some basic economic information (income level category and lending type). Of interest here are the country codes and the country name:
countries[0]['name']        # country's name
> 'Aruba'
countries[0]['id']          # Worldbank's country code
> 'ABW'
countries[0]['iso2Code']    # ISO country code (two letters)
> 'AW'
Aruba?
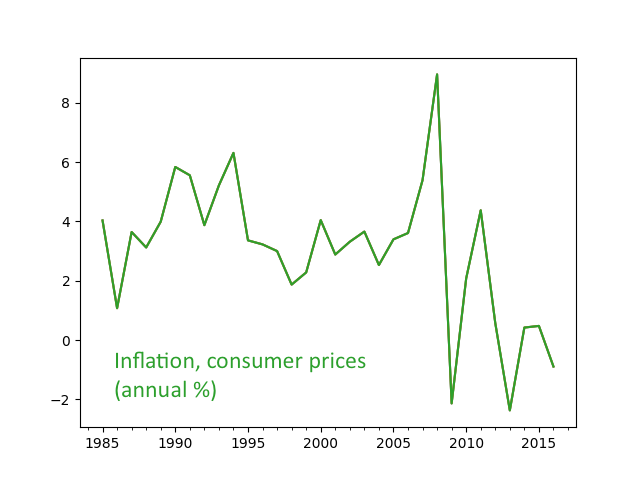
Let's continue with the first country in the list, Aruba. (Where the heck is Aruba? Easy. Extract latitude and longitude from the dict, that's 12.5167,-70.0167, and head to google maps.)
Now, the inflation data of Aruba is obtained with get_data:
data = wbdata.get_data("FP.CPI.TOTL.ZG", country="AW")
As usual this is a list of dicts from which we have to extract the relevant information. The Worldbank API tends to return rather verbose datasets, so in general it is necessary to inspect the data a little. This is best done in an interactive session, e.g. using IPython.
dict([(int(d['date']), float(d['value'])) for d in data if d['value'] is not None])
> {1985: 4.03225806451611,
   1986: 1.07396640826842,
   1987: 3.64304545817689,
   ...
  }
Here a list comprehension was used to obtain a list of date/value tuples which then was turned into a dictionary of date->value using dict.
Pandas
For further analysis and plotting we can turn to pandas. Again, we first create the date->value dict as before,
infl = dict([(int(d['date']), float(d['value'])) for d in data if d['value'] is not None])
then a timeseries can be constructed like this:
import pandas as pd
dt = [pd.datetime(y,12,31) for y in infl.keys()]
ts = pd.Series(list(infl.values()), dt)
(Note that the .keys() and .values() are in 1-1 correspondence as long as the dict is not changed between calls.)
Let's plot the graph:
ts.plot().get_figure().savefig('inflation-aruba.png')
Wbdata's convencience functions
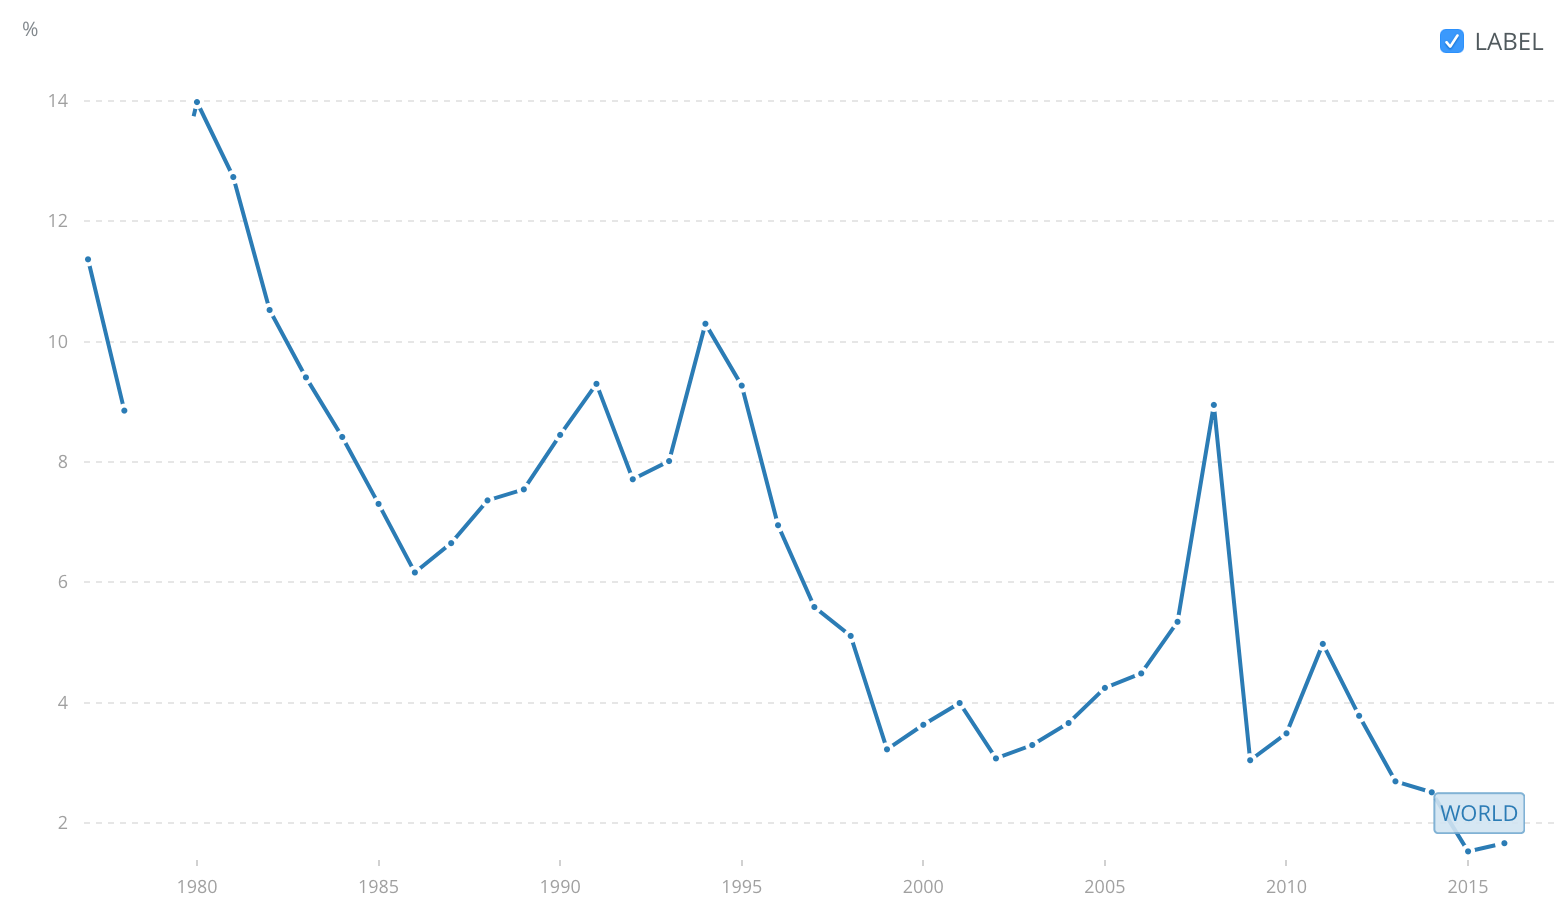
Because the Worldbank datasets are so clunky, wbdata offers a number of convenience functions that come in handy. For example, get_dataframe downloads a set of indicators and merges them into a pandas DataFrame:
df = wbdata.get_dataframe({'FP.CPI.TOTL.ZG': 'value'}, country=['USA', 'CHN', 'DEU'])
This dataframe cannot be plotted, yet, because get_dataframe returns a pivoted (stacked) dataframe. This can be fixed:
df = df.unstack(level=0)
Then plot as usual
df.plot().get_figure().savefig('inflation-usa,chn,deu.png')
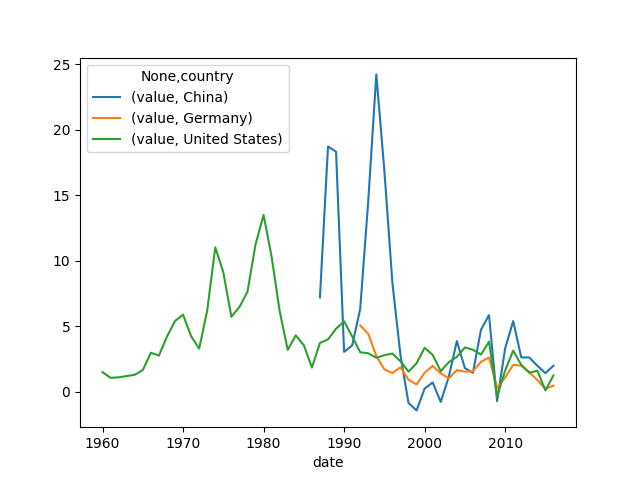
The plot isn't quite perfect, yet, but with some cleaning up of column names it becomes presentable.
If you want to get all the countries you can specify country='all':
df = wbdata.get_dataframe({'FP.CPI.TOTL.ZG': 'value'}, country='all')
df = df.unstack(level=0)
The 2016 inflation rates can then be extracted with .at()
df.loc["2016",:]
> value  Afghanistan          2.169452
         Albania              1.282799
         Algeria              6.397714
         American Samoa       NaN
         ...
Conclusion
wbdata and pandas provide powerful tools to quickly obtain and analyze the Worldbank's open data. Hopefully this short tutorial got you on the way. Please feel free to leave comments/suggestions/critique below.